
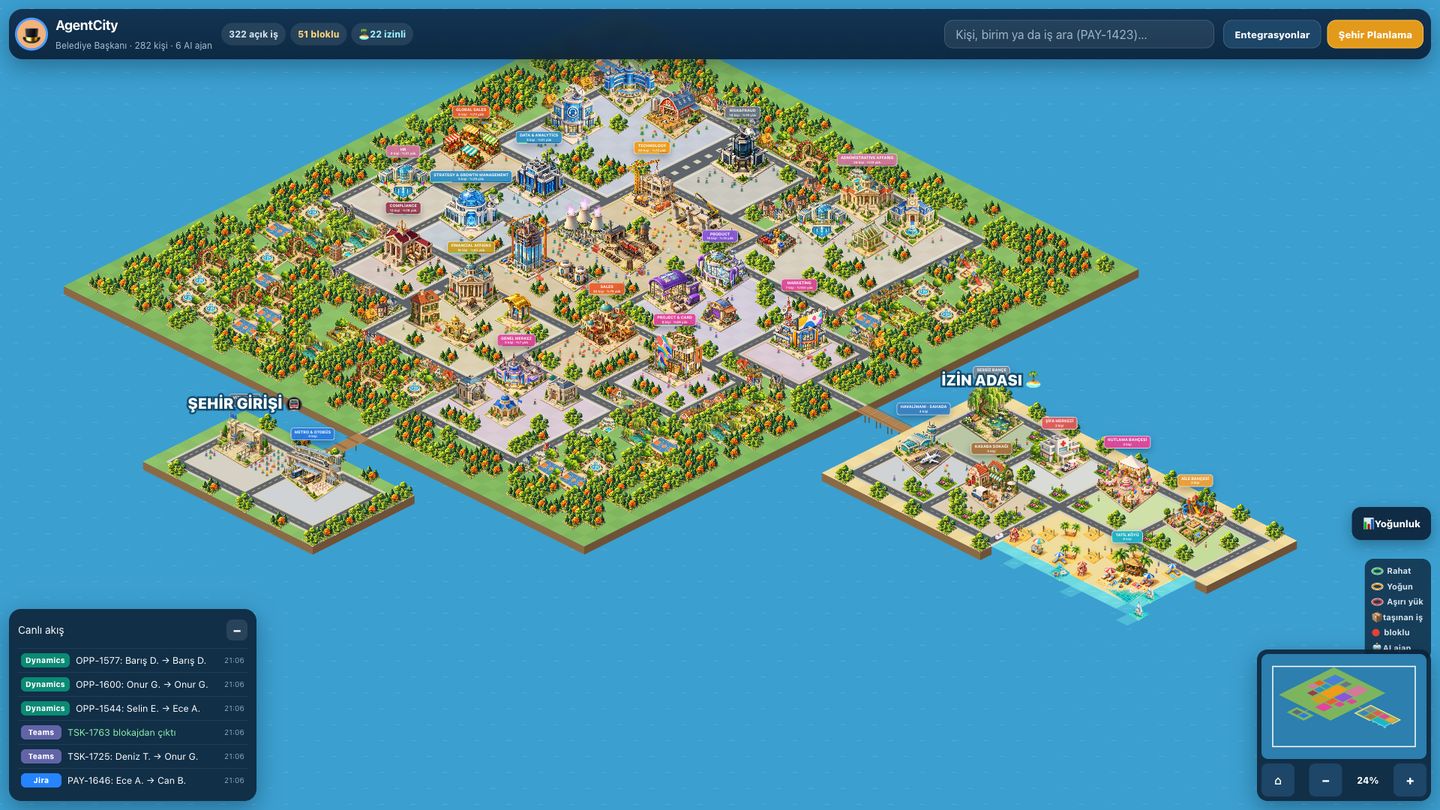
What the city tells you
Departments as neighborhoods
Infra runs the train station, engineering works the construction site, the database team guards the data silos, sales runs the market. Add a department and it picks a building from its name and places itself.
Work as traffic
When an issue changes hands, a truck drives between neighborhoods. Click it to see where it came from, who it passed through, who holds it now and what blocks it.
Load you can see
Crates pile up at teams over capacity and the density layer shows open and blocked work per department. Nobody has to say “we’re a bit busy”.
Incidents as city damage
A network outage derails a train, a database incident cracks a silo, a broken build collapses scaffolding — and fire trucks, ambulances or repair crews rush in.
Leave Island & city gate
People on leave relax on Leave Island by leave type; those not in the office yet queue at the city gate. Meetings show as speech bubbles.
Humans and AI agents
AI agents work alongside people as little robots, so you can see what they pick up and hand over in the same live feed.
Screenshots
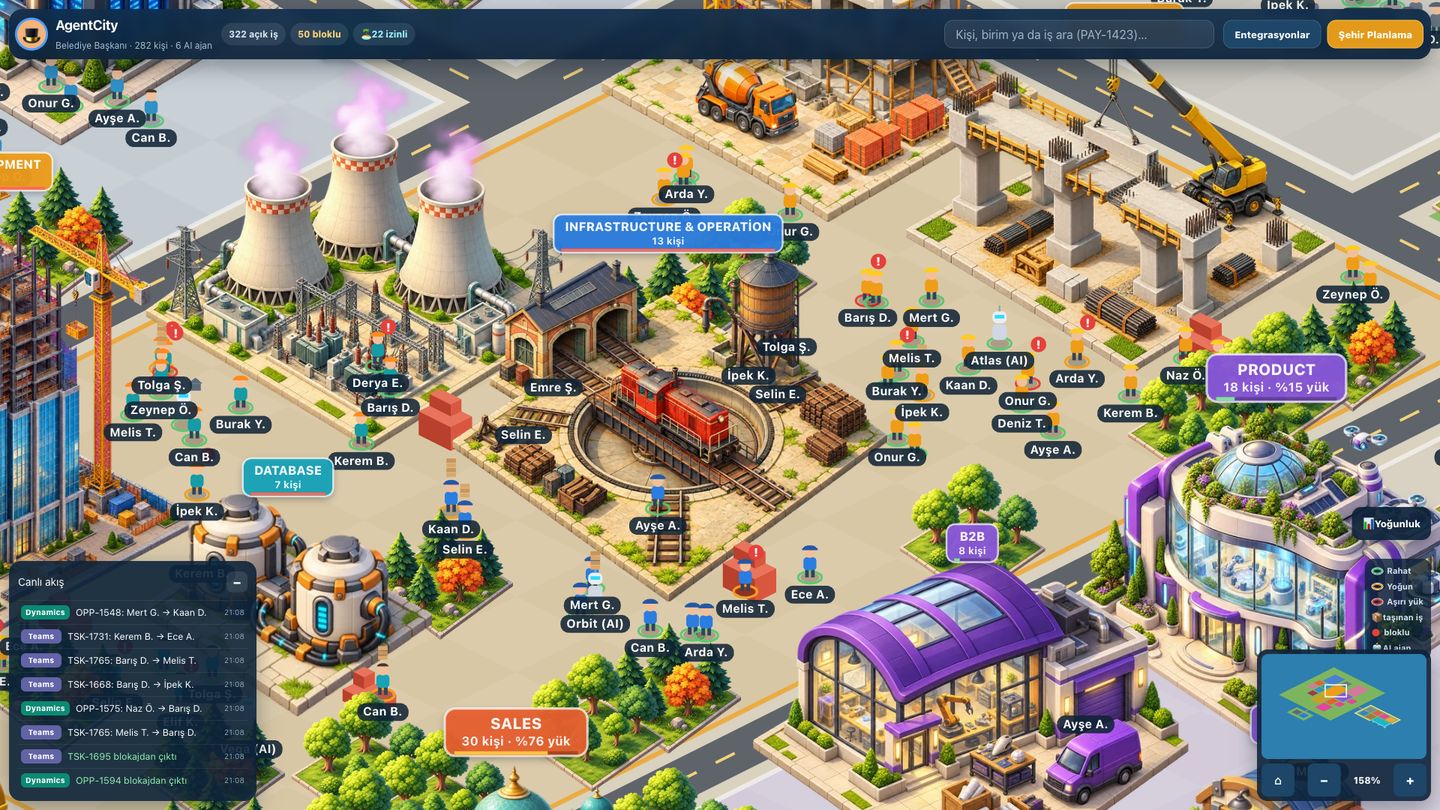
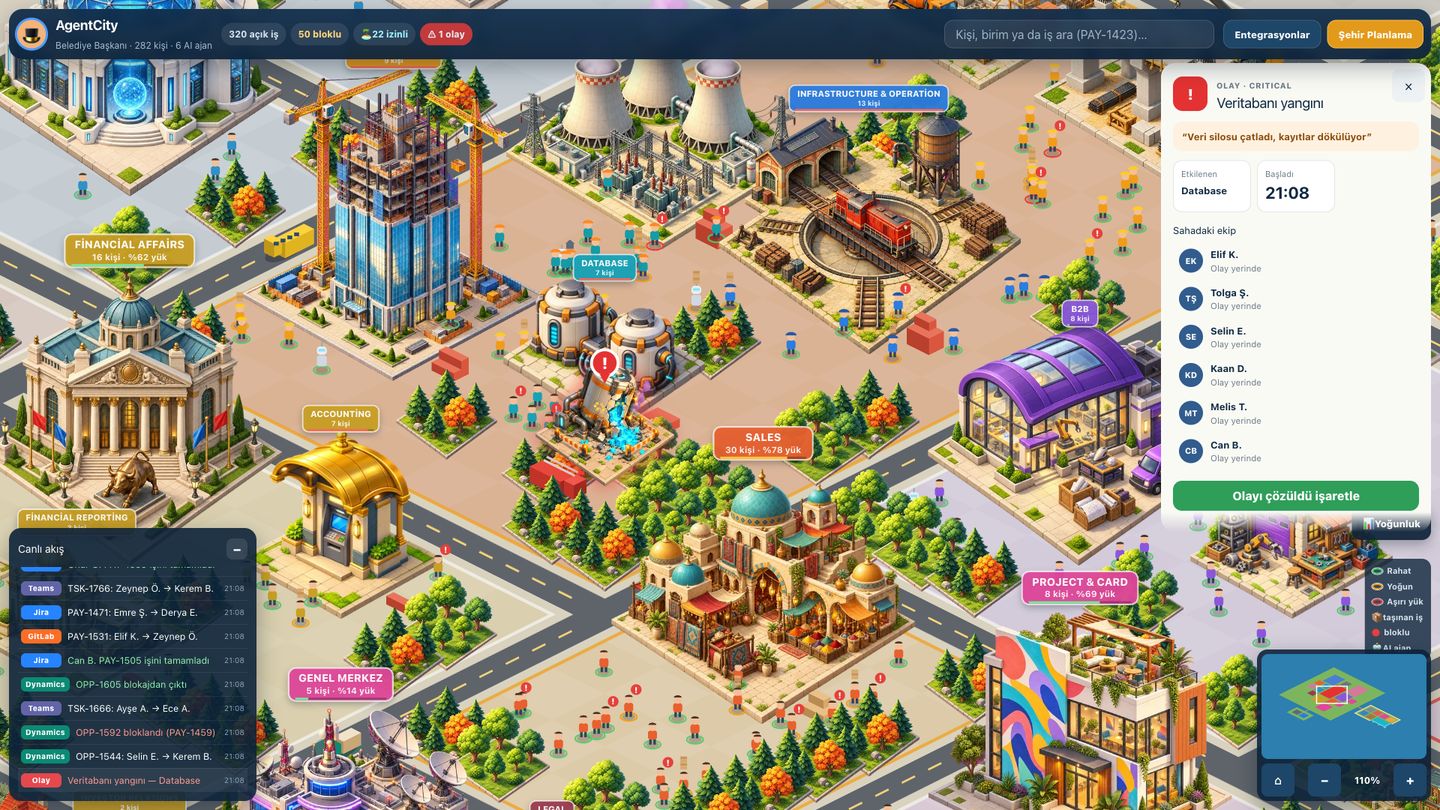
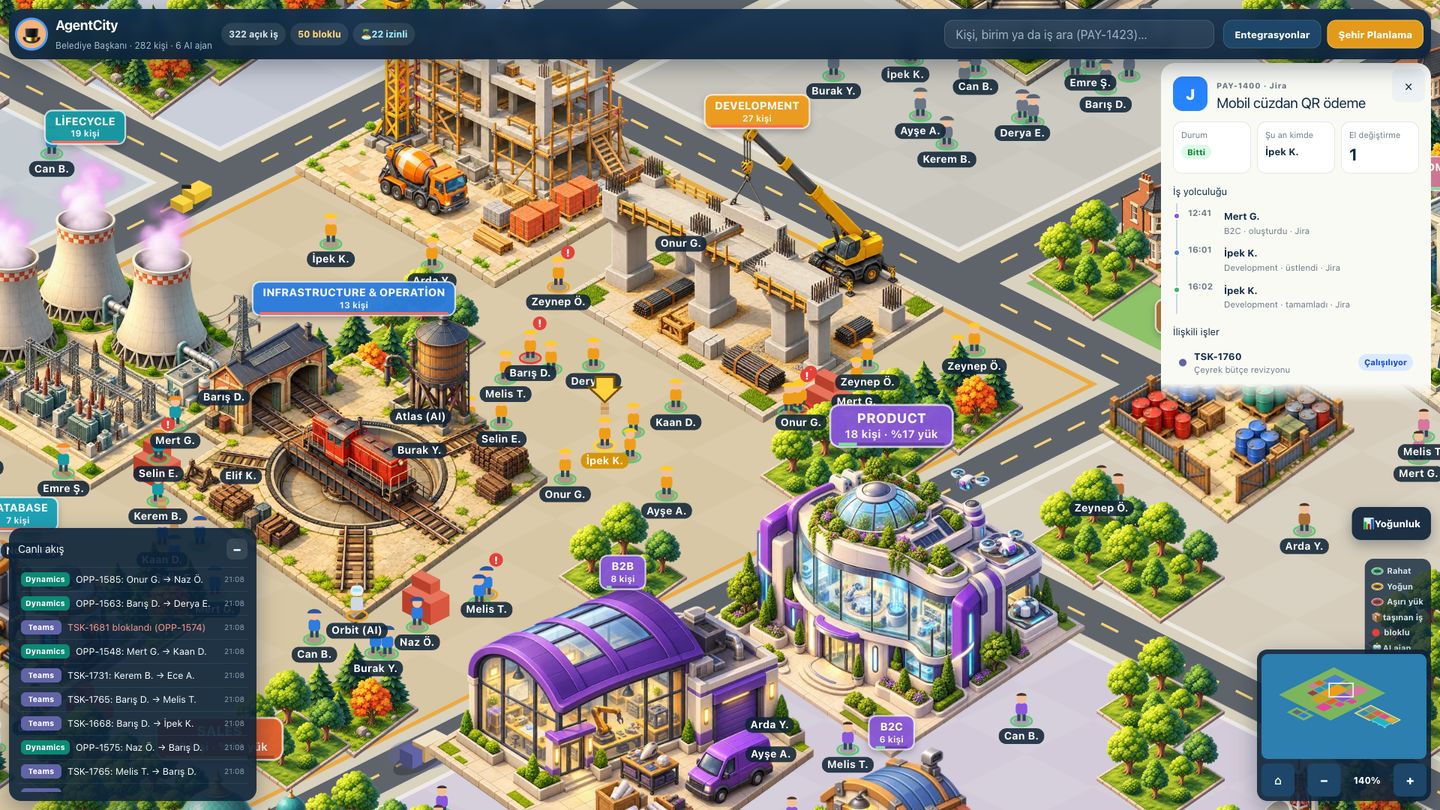
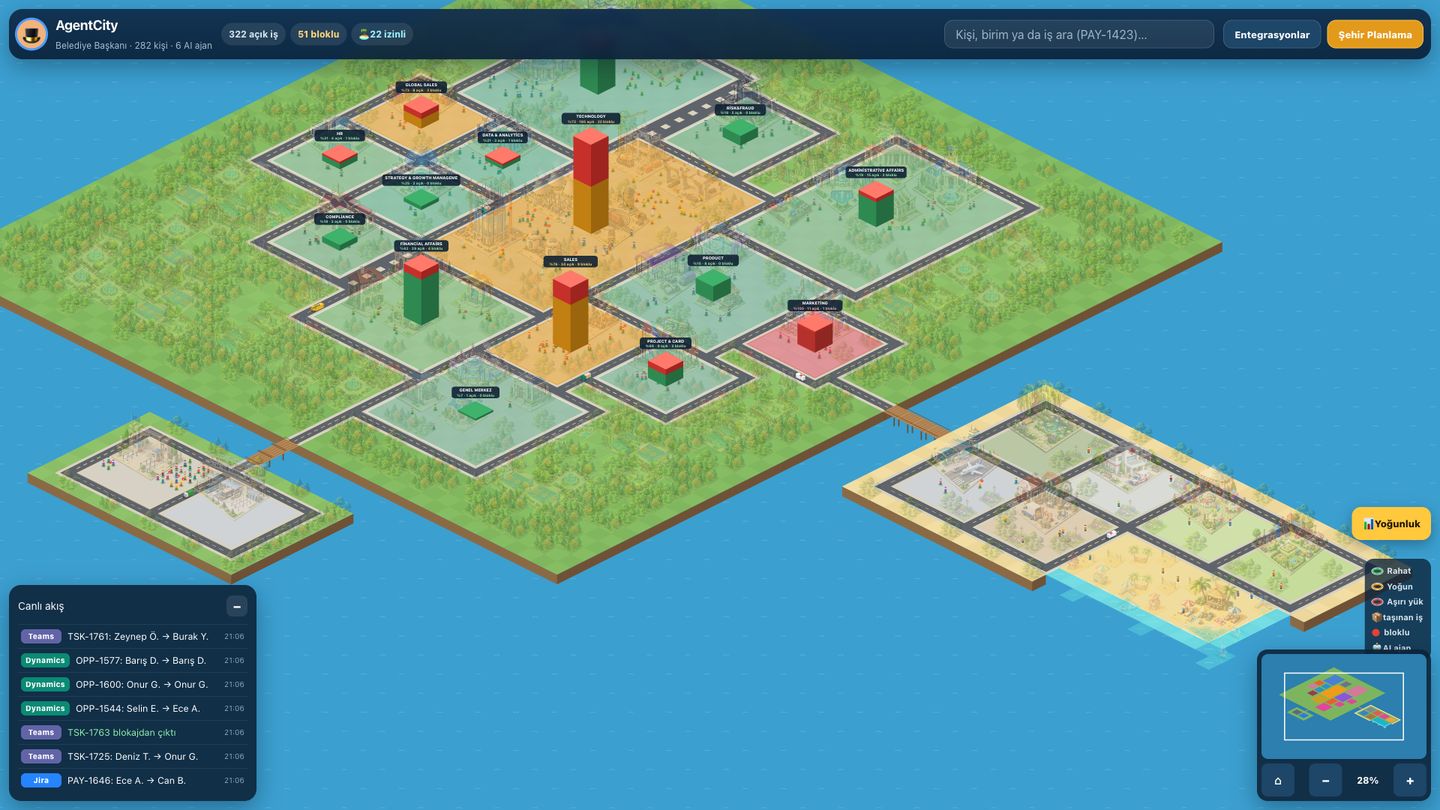
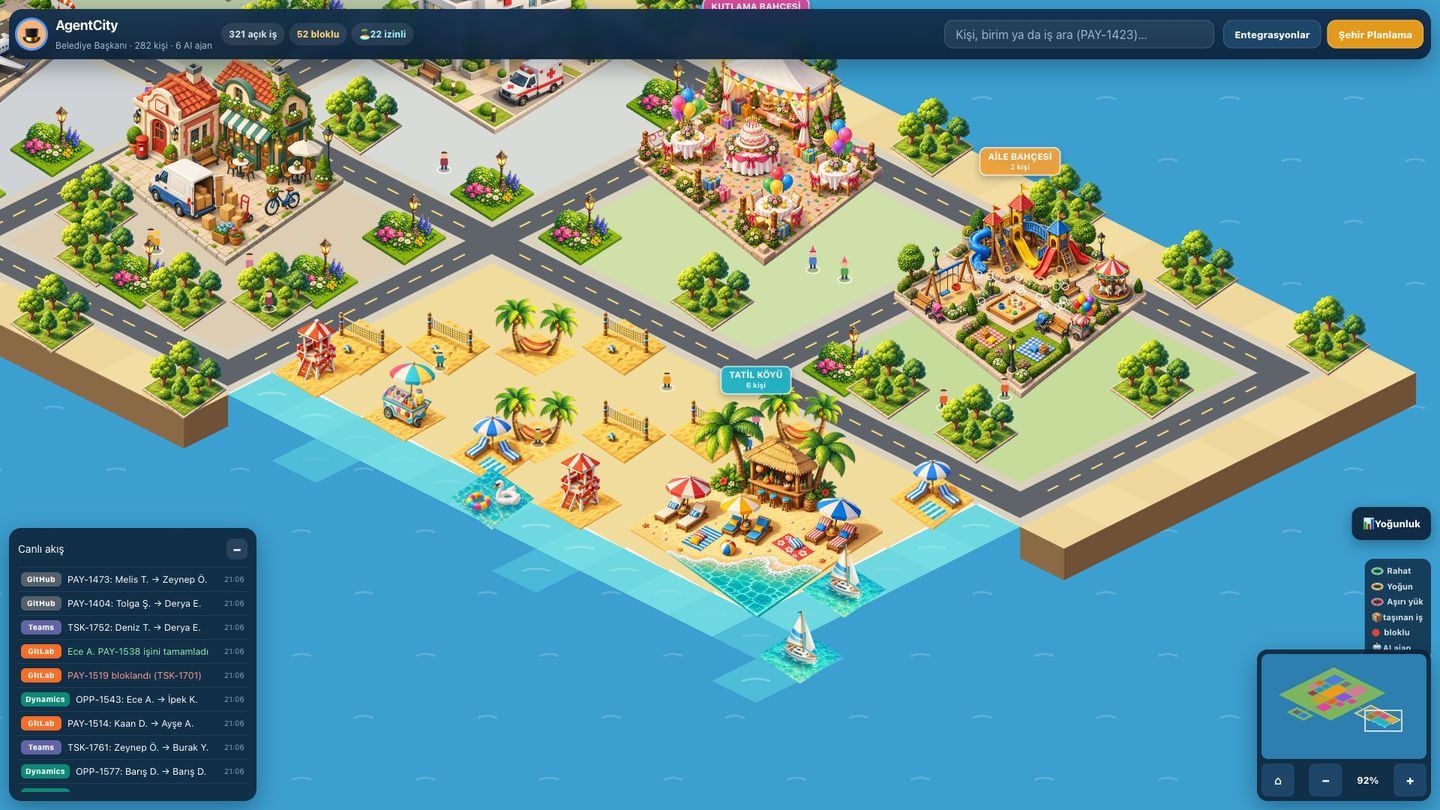
Screenshots use a fictional demo company; all names and work items are made up.
Connects to the tools you already use
People
KolayİK, any HR system that exports JSON, or a CSV/XLSX import.
Work & code
Jira Cloud and Data Center, YouTrack, Asana, Trello, GitLab, GitHub and Bitbucket.
Requests & meetings
Dynamics 365 tickets as a queue, Microsoft 365 / Teams presence as meeting bubbles.
On-call, security & access
Oncallz and PagerDuty incidents, Wazuh security alerts, iCard office entries.
Built to be trusted with company data
Read-only by design
Connectors only read. Credentials are write-only in the UI and encrypted at rest with a separate key per workspace.
Tenant isolation
Each workspace sees only its own data, enforced in the database with row-level security — not just in application code.
Flow, not a leaderboard
AgentCity shows bottlenecks and flow, not rankings of people. Sensitive leave types can be hidden, and personal identifiers never reach the browser.
Status
AgentCity is in private beta and runs either as a multi-tenant service or as a single-company on-prem install. Want to see your own company as a city? Get in touch.